June 1, 2026, 21:45 New York time. The gold future is falling. In a single 15-minute bar, price slips below the low that has held the range since midday, 4,493.1, and prints 4,492.3. Anyone who was long, with the stop where every textbook puts it, just below support, is now out. Anyone shorting the break feels vindicated.
An hour later price is back in the middle of the range, shortly before midnight it closes above the range high, and at three in the morning gold trades at 4,571.3, 79 dollars above the low. The break was no break. It was a Spring, the phase C event on which setup family 1a/1b of the WVPO method is built.
And yet the rules allow no trade that evening. Neither the aggressive buy at the low nor the conservative one after the structure break. If you want to understand why, you have to live through the moment itself, before you know how it ends. That is why this tool is on the page: a test bench for the diagnosis, not for the outcome.
Why a test bench and not a chart
A Spring is a question put to the market: is supply still waiting below the range low? The Composite Man pushes price below the edge, to where the buyers' stops sit. If price comes back, the question is answered. If it stays below, it was a genuine break.
The break is the question. The reaction is the answer.
Book II, chapter 20 turns this into two measurements that are already available at the low, and one condition that comes afterward. Depth: how far below the range low does the low sit, measured in ATR of the range timeframe? Volume: does the low come without supply, that is, with no more than the usual volume, or with supply, that is, as a shakeout? Then the structure break, which turns a thesis into a finding. Without supply, setup 1a may buy the low. With supply, setup 1b has to wait for the quiet test and the structure break.
The data basis is split and labeled. The replay case is real: COMEX gold, August contract GCQ2026, 15-minute bars, June 1, 12:00 to June 2, 06:00 New York time, documented in the knowledge base as a verified case. The tool measures the volume of every bar against the time-of-day average, that is, against what was usual at the same time of day in the twenty sessions before. The comparison path "genuine breakdown" and the six drill cases are model constructions from the setup's parameters, marked ◐ MODEL in the tool. None of it is a signal. It is a training device.
The tool
Start with "Play" and stop the session as soon as you would sell.
Evidence lens
Bar 17/69 · Jun 1, 16:00 ET · Close 4,513.4 · Volume 0.98 × time-of-day average · Close position 70 % · above the range low
The guided tour: seven handles, seven findings
The order is deliberate, from the simplest gesture (watching) to the hardest (grading yourself). Take two or three minutes for each section.
1 · Crime-scene replay: the market does not know its future
What: Press "Play." The session runs bar by bar, as it ran that evening. At the low the replay stops on its own. With the slider and the "−1/+1" buttons you move freely along the time axis.
Why: On the finished chart the Spring is a wick, harmless, almost elegant. In real time it is a falling series of red candles, and nothing about it reveals that it will turn. Book I, chapter 10 calls this the perspective trap: whoever reads charts backward believes they are more accurate than they would ever be at the right edge. The replay restores the right edge.
Exercise: Start at bar 1 and stop at the bar where you would have sold in real life. Note the number. Then stop a second time, at the bar where you would have bought. At the end of the replay, compare both moments with what the rules would have allowed.
2 · Evidence layers: four looks at the same wick
What: Below the chart are four switches: Wyckoff, volume profile, structure, volume. Each lays a layer over the scene. Wyckoff shows the two edges of the range and the phase band (range, shakeout, test, Sign of Strength). The volume profile shows POC, VAH and VAL of the range before the Spring. Structure shows the last lower high on M5, the CHoCH and the break on H1. The volume bar shows every bar against its time-of-day average.
Why: Bare price is ambiguous. That is not a weakness of the observer but the nature of the thing. The WVPO method answers with the WVPO Funnel, and here you see what each layer contributes. The range low is the Spring's measuring line, not the VAL of the profile. The profile supplies the targets: the POC of the range is the first, the VAH the second. Structure names the moment a recovery turns into a structure break. Volume decides which of the two entries is even in play.
Exercise: Set the slider to the bar of the low and switch the layers on one at a time. Before each switch, ask yourself: what do I expect to see? Whoever first guesses the edge and then checks it learns twice over.
3 · Evidence lens: supply is measurable
What: The lens below the chart shows for every bar the close, volume as a multiple of the time-of-day average, the close position within the candle's range and the distance to the range low in dollars and in ATR. At the low it sums up the finding: 0.09 ATR below the edge, 2.28 times the volume, close at 57 percent, back inside the range.
Why: Whether supply was waiting below the edge is not a feeling but a picture in numbers. Book II, chapter 20 draws the line at 1.0: if volume at the low is no higher than the usual average, it is a Spring without supply, and 1a may buy if the four-window consensus shows A or A+. If it is higher, the low counts as a shakeout with supply, unambiguously so from twice the average. Then the low is not bought. That evening 2,118 contracts traded in the bar of the low; around 930 were usual at that time of day. The time-of-day average matters here: measured against the quiet bars of the preceding hours, the same bar would look like four times the volume.
Exercise: Read the lens at the low (bar 36), then at the test (bar 40). The low came with 2.28 times the volume, the test an hour later with 0.73 times and a higher low. This is exactly the sequence setup 1b demands: first the shakeout, then the quiet test.
4 · A/B comparison: two worlds, one low
What: The "Path after the low" switch swaps the continuation. Path A is the real Spring, path B a modeled genuine breakdown, marked ◐ MODEL. Down to the low, both paths are identical, candle for candle.
Why: This is the core thesis made tangible. No one can read off the bar of the low which path follows; the information does not exist there yet. What is already settled at the low is the volume finding, and it applies equally to both paths: a shakeout with supply, no 1a. In path A the quiet test follows, then the structure break. In path B price falls back below the edge and accepts there; no test comes. The rule would have bought nothing in path B. It did not need to know which path was coming.
Exercise: Run path A to the end, then path B. Do not watch the direction (you already know it), but the moment at which you would first have been allowed to act in each path. In path B the answer is: never.
5 · Trade plan: an entry without a target is not a trade
What: In the second mode you drag the entry and stop lines straight onto the chart or use the plus/minus buttons. The reward-to-risk ratio computes live against the range's target ladder: TP1 at the POC, TP2 at the VAH or at the AVWAP from the range high, whichever is higher, weighted 50/30/20. It is compared against the setup's minimums: 3.0 for 1a, 2.0 for 1b with stop A.
Why: 1b buys after the structure break. That evening the M5 CHoCH came at 23:25, the H1 break with the hourly close at midnight at 4,529.5. By then price was already above the range high, above the POC (4,513.2) and the VAH (4,521.3). Both targets lay below the entry; the weighted R:R is negative. No target, no trade. The Spring was real, but the confirmation came too late to trade it by the rules. The plan shows the aggressive 1a only as a line: it is blocked by the volume rule, and for a trade the rule excludes, the test bench computes no R figure.
Exercise: Select "1b · after the break" and read the finding. Then lower the entry until the weighted R:R reaches 2.0, and check on the chart whether price ever came back there after the H1 break. Variant B of the setup (a limit on the pullback into the Spring AVWAP zone around 4,512) would not have been filled that night.
6 · Blind drill: your verdict against the rule
What: The third mode shows six model cases, each stopped right after the push below support. Consensus and regime are given; the lens measures depth, volume and close. You make one of three decisions: buy the low (1a), wait for test and break (1b), no trade. Only then does the resolution run, and the rule explains the right choice.
Why: The consensus matrix from Book II, chapter 20 is the core of the family. A+ in regime I allows 1a at full size, A at half size. On yellow (regimes II and III) only A+ may buy the low; A becomes 1b. B means wait: in green for 1b at half size, on yellow not at all. C is noise. Above all of this sits the volume rule: if the matrix allows 1a but the low comes with supply, 1a becomes 1b. The drill forces you to apply this chain under uncertainty instead of knowing it by heart. Expect to be wrong at first. That is the point.
Exercise: Judge all six cases in one sitting. One of them shows consensus A+ in regime I and is still not a 1a. Once you have found it, you have understood the core of the gold evening: a volume spike at the low is not a buy signal but a reason to wait.
7 · Hit rate: repetition beats opinion
What: The counter above the drill keeps the books: hits, attempts, running streak, best score. It stays saved on your device and carries over across sessions. No countdown, no leaderboard, no pressure.
Why: Diagnostic certainty is trainable, but only against an honest measurement. Every serious operator knows a journal for trades. A journal for judgments is rarer, even though the loss usually arises in the diagnosis already, not only in the management. The counter is its smallest form.
Exercise: Two complete runs through all six cases, on two different days. If the second run does not come out better than the first, read the resolutions again, not the charts.
Limits & honesty
This tool has clear limits, and they stand here, not in the fine print.
Filters cost winners. The gold evening is the uncomfortable case study: the Spring was real, price ran 79 dollars, and the rules bought nothing. That is not a flaw in the rules but their price. The same volume rule that skipped a winner here skips the shakeouts that turn into a breakdown. On the evening of June 2 at 19:15 price fell below the Spring low; three days later gold stood at 4,336.6. Since mid-April the weekly chart had shown lower highs and lower lows, so the Spring ran against the higher-timeframe direction. A positive case study under the same rules is in Book II, chapter 20: gold on February 14, 2024, a low without supply, 1a from 2,000.0.
One case is not a sample. The replay case is real and verified, but it is exactly one case. The setup family's key figures (56 and 67 percent win rate, +0.45 and +0.38 R expectancy) come from the model sample in Book II, chapter 20.6. They describe a teaching example, not a trading history.
The model paths are constructions. The breakdown path and the six drill cases were generated from the setup parameters so that the evidence fits the label. Real markets are messier. The gold evening itself shows it: at 0.09 ATR, the low fell just short of the starting band for Spring depth (0.1 to 1.0), a borderline case. The drill teaches the rule; the market tests the exception.
The landmarks depend on the methodology. POC, VAH and VAL are computed quantities. The tool builds the profile of the range before the Spring from 5-minute bars, with a 70 percent value area. Whoever works with different profile settings gets different edges. That is no fault of the concept, but a reason to think in zones rather than lines.
Correction of October 10, 2026. Until that day the tool showed the same evening as a successful 1a buy at the VAL with +2.96 R. It contained two errors. The times were UTC but labeled as New York time, so the Spring came on June 1 at 21:45, not on June 2 at 01:45. And the measurement was taken at the VAL instead of the range low, with the volume spike as the buy signal. Book II, chapter 20 in the October edition measures at the edge and reads a spike at the low as supply. The companion podcast taught the old reading and is therefore offline.
And the obvious: The test bench produces no signals, no forecasts and no recommendation to re-trade June 2026. It trains a diagnosis. What you do with it belongs in your process, your risk management and your understanding of the risk notice.
Case vocabulary
The three anchor terms of this post, verbatim from the WVPO glossary:
Spring: "Phase C event: a sharp undercut of support followed by a reclaim (liquidity grab). Anchor of Setup 1a/1b." (Book II, ch. 20)
CHoCH (Change of Character): "Structural break that shatters the micro-structure of the ongoing phase (layer 3). Trigger for the conservative entry (1b)." (Book I, ch. 15)
Four-window consensus: "Forensic classification at the decision point from four windows; A+ (4), A (3), B (2), C (1 or 0). Governs the 1a-vs-1b choice." (Book II, ch. 20)
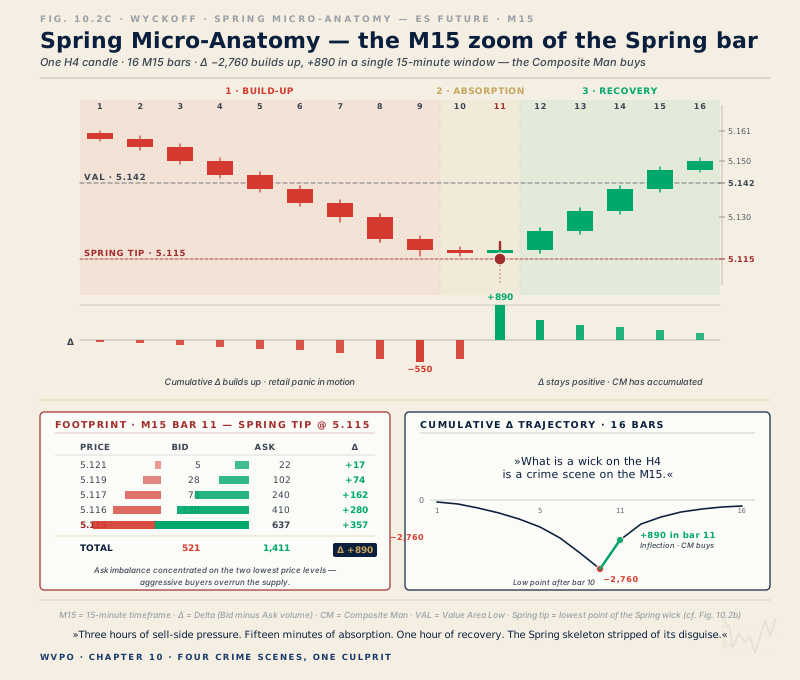
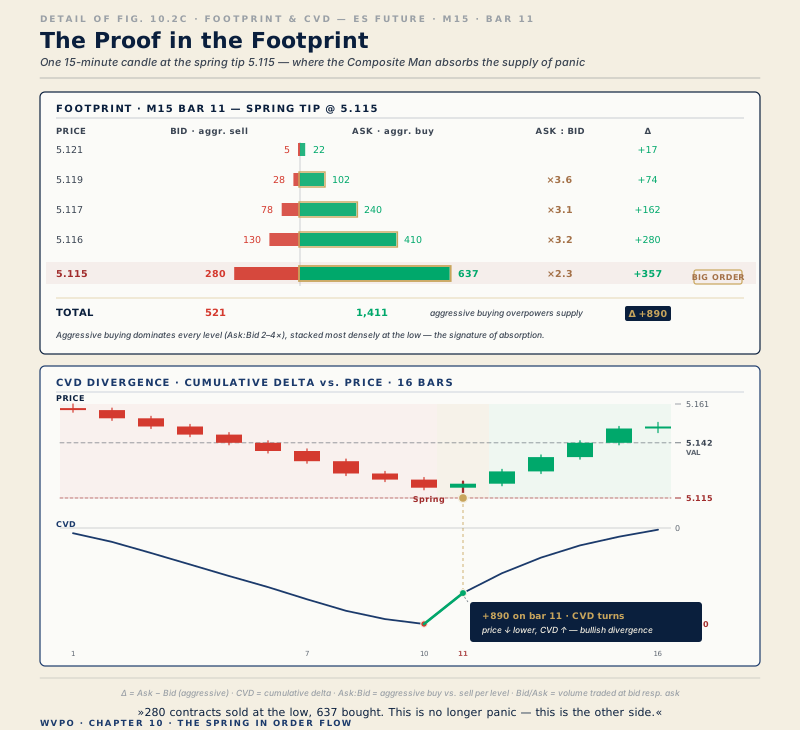
If you want to go deeper into the anatomy of the Spring (build-up, absorption, recovery at the footprint level), you will find the teaching piece in the post "The Spring: Anatomy of the Final Stop Hunt". The test bench is the practice hall that goes with it.
The printable tool cheat sheet
The six key rules of this tool as a printable page for your trading desk — double opt-in, unsubscribe anytime.