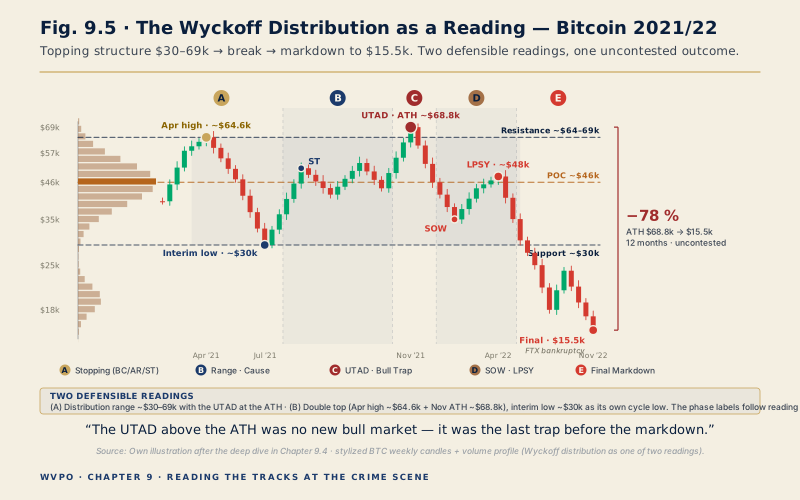
21 July 2021. Bitcoin trades at 29,970 dollars — 55 percent below the April high of around 64,600. The market has run sideways for weeks, and at this right edge of the chart stands the only question that counts: is this the floor of a reaccumulation, from which the next upward wave emerges? Or a way station in the markdown, a pause before it falls further?
Whoever calls "distribution, hands off" on this day misses around 130 percent: by 10 November, Bitcoin rises to its all-time high at 68,790 dollars. Whoever up there, at the next right edge, calls "reaccumulation, stay long" meets the counter-reckoning — minus 78 percent down to the FTX low at around 15,500 dollars, twelve months later. Both premature labels were punished, within months, with the account as the receipt.
The point behind it stands in Book I, chapter 9 — and it is more uncomfortable than any textbook graphic: even hindsight has to this day not agreed on this case. The 2021 topping structure can be read as one large distribution range or as a double top with a bear market of its own in between — both readings are defensible, neither is proven. But if not even the rear-view mirror carries the verdict: what protects you at the front then, at the hard right edge, where you have to act before anything is settled?
The WVPO method's answer is not a better eye. It is an interrogation — with fixed questions, a burden-of-proof rule and three permitted answers. This tool runs it, at a crime scene whose future is sealed.
Why an interrogation and not a look
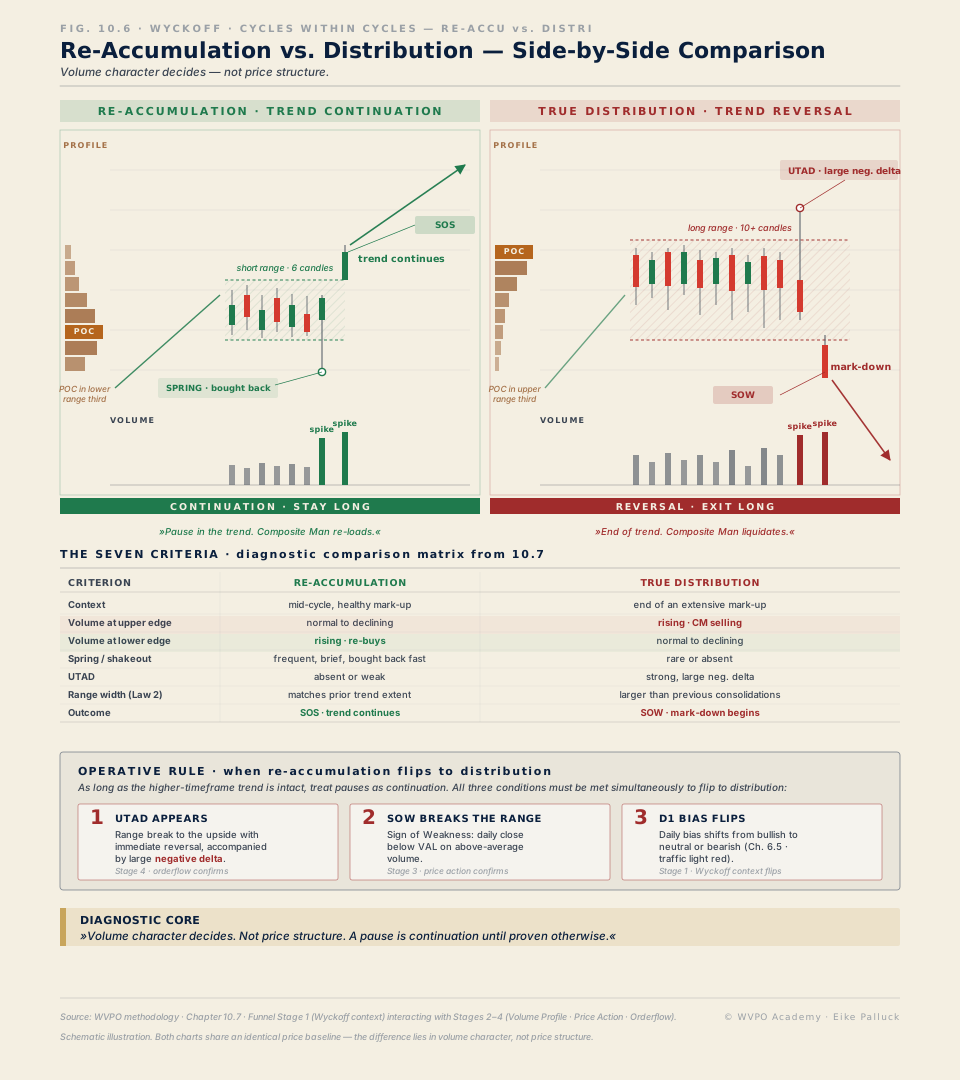
Chapter 9.4 states the problem in one sentence: in hindsight every phase is obvious, live it never is. A UTAD, in the moment it forms, looks like a breakout. A spring looks like a breakdown. And a reaccumulation looks like a distribution — at the price level the two are, over long stretches, indistinguishable. Chapter 10.7 calls this distinction the operationally hardest question in all of Wyckoff analysis, and it is at the same time the one with the most expensive errors: whoever takes a pause in the trend for the end misses the second half of every move. Whoever takes the end for a pause hands back the gain of the first half.
The book answers the question with three building blocks, all of which sit inside this tool.
First, a default. A pause in an intact trend is treated as reaccumulation until the opposite is proven — and the counter-proof needs three things at once: a UTAD with high negative delta, a SOW below the range and a change of the D1 bias. The mirror rule belongs to it: no SOW, no distribution. A probe above the high without a subsequent break to the downside is collected liquidity, not a trend change.
Second, a protocol. The 4-node test from chapter 10.7 puts four questions to the range in fixed order — D1 bias, range size, volume distribution, the UTAD question — and it is built conjunctively: one node without a yes is enough, and the continuation long is off the table. The verdict is not a gut feeling, it is the result of this protocol.
Third, a third answer. As long as the features do not point unambiguously in one direction, the bias reads neutral — not guessed. "Not yet decidable" is a full answer in the interrogation, often the only covered one. The most expensive error is not the wrong label. It is the premature one.
From this follows the core thesis of this post: the decision reaccumulation or distribution is not made in price but in volume character — and it is made later than the gut wants. Whoever guesses right early has still not read. Exactly that can be trained, and exactly that is what this tool measures.
On the data basis, openly stated: all price paths in this tool are model constructions — teaching geometry, built on the thresholds of chapters 10.5 and 10.7 and marked ◐ MODEL in the tool. The rules, nodes and thresholds, by contrast, are not an invention of this page: they come verbatim from the WVPO knowledge base, the vetted rule set behind book, academy and app. Nothing here is a signal. It is an interrogation room.
The tool
Start the tape in crime-scene mode and let the range form at the sealed edge — and decide along the way when you would commit.
A markup runs into a sideways phase. To the right of the edge the future is sealed — exactly how you see it in live trading: not at all. Run the tape and watch when the dossier answers its questions.
Node 1: the look upstairs (D1)
The first interrogation question is not asked inside the range — it lives one timeframe higher. Flip the D1 context and watch what happens to the continuation default.
D1 bias bullish: three higher highs, three higher lows, the pauses are proportional. Node 1 = yes, continuation default active.
The burden-of-proof dossier
The 7 traits from ch. 10.7. Tap a trait to highlight its evidence bars in the chart. Grey = the question is still open.
State of the dossier: 1 × reaccumulation · 0 × distribution · 6 open
The guided tour — seven handles, one verdict
The order is deliberate: first the stage, then the instruments, last the real thing. Take two or three minutes for each section.
1 · The sealed edge — rear-view mirror taped over
What: In crime-scene mode a markup runs into a sideways phase. With "Play", "+1 candle" or the scrubber you move through time — but to the right of the edge the chart is physically hidden. The future does not exist for you until you reach it.
Why: Whoever studies phases on the finished chart learns the wrong skill — they memorize resolutions instead of practicing diagnoses. The sealed edge restores the working condition of real trading: you see exactly what an operator would have seen that evening, and not a pixel more. Watch the "End ?" readout as you do — it stays put until the resolution is reached.
Exercise: Run the range to just before the test (around candle 35) and stop. Ask yourself seriously: would I go long, short or nothing here? Note the answer — you will measure it against the evidence in section 6.
2 · The burden-of-proof file — seven questions, kept live
What: Beside the chart lies the file: the seven discriminator features from chapter 10.7, from context through the two volume flanks to the outcome. Each feature shows its state — argues for reaccumulation, argues for distribution, still open — and a tap on it marks in the chart the candles that currently answer it. The two volume-character features carry the note "counts double": the book expressly makes them the heaviest criterion.
Why: A bias is not an opinion but a sum of measurable answers. The file makes visible what most traders suppress: in the middle of phase B, five of seven questions are simply unanswered. The counter beneath the file — so many features per side, so many still open — is the most honest short form of your evidence.
Exercise: Set the scrubber to the middle of the range and read the file's state. Then tap "Volume at the lower edge" and see which candles are supposed to answer the question — and whether at this point they can even do so yet.
3 · The look upward — node 1 does not play inside the range
What: Below the crime-scene chart lies the D1 context with two switches: in one, the same M15 range sits in the middle of a healthy daily uptrend — three higher highs, three higher lows —, in the other, after a lower high and a lower low. The finding beneath changes with it, and in the file the context feature flips.
Why: The first question of the 4-node test is not "What does the range look like?" but "Is the daily bias bullish?" — and it decides everything that follows. Chapter 10 gives the reason in its hierarchy rule: an M15 "accumulation" inside a D1 distribution is not a buying opportunity, it is a trap — the reaccumulation of the sellers, reloading for the next downward push. If node 1 falls, there is no reaccumulation suspicion left, no matter how inviting the range looks.
Exercise: Switch to "D1 flipped" and read the exit-1 finding. Switch back. The same M15 candles, two different starting positions — if that unsettles you, the exercise worked: context comes before the range, not inside it.
4 · The volume-character slider — identical candles, a flipped verdict
What: The lab mode shows a complete range core and a single slider. It shifts the volume distribution steplessly from the lower range edge to the upper — the candles stay unchanged, the total volume stays exactly the same. On the right the 4-node test runs live along; three nodes are fixed in this scene, only node 3 hangs on the slider. At the 50 percent mark the protocol flips: "reaccumulation confirmed" becomes "suspicion — keep checking".
Why: This is the core sentence from chapter 10.7 made tangible: volume character decides, not price structure. If the volume maximum sits at the lower edge, someone is buying there systematically — the behavior of an accumulator. If it moves to the upper edge, supply is being handed into the rallies. Note also what the slider does NOT do: it never jumps to "distribution confirmed". A volume suspicion alone is amber, not a verdict — for the red label the protocol demands the UTAD or the SOW.
Exercise: Find the tipping point two ways: once roughly with the mouse, once finely with the arrow keys. Measure how many percent of redistribution lie between "clearly at the bottom" and the tip — and consider how confidently you would estimate that difference by eye in a real chart.
5 · The two endings — where the worlds part
What: The "Two endings" mode places two charts side by side that share the same first half of the range — candle for candle, volume for volume identical; the tool checks this hard when building the data. Then the paths part: on the left spring, SOS and LPS through to the continuation, on the right UTAD, SOW and LPSY into the markdown. A synchronized scrubber runs both sides at once.
Why: The comparison answers the question the sealed edge raises: where exactly could you have seen it? Not everywhere — at three nameable places. First at the test: a probe downward with buy delta above the threshold against a probe upward with heavy sell delta. Second at the volume flank: expansion on the up move or on the down move. Third at the edge reaction: a higher low above the old edge — or a lower high below it. Everything before that is congruence, and congruence carries no verdict.
Exercise: Run the scrubber slowly from left to right and speak aloud what you see — up to which candle you say the same words for both sides. That candle number is your personal proof of how long "not yet decidable" was the only honest answer.
6 · The interrogation protocol — the timing is scored too
What: The real thing: six sealed cases, each at the sealed edge. At four hold points per case you give your verdict — reaccumulation, distribution or "not yet decidable". Only then does the seal fall, and the resolution scores each answer individually: a hit when it matches the evidence at that moment. Cautious when you stay neutral even though the proof was already there. And early verdict — zero points — when you assign a label before the evidence covers it. Even when it happens to be right in the end.
Why: This is the mechanic that separates this tool from any phase quiz. A one-off verdict on the finished chart measures knowledge; a verdict series at the sealed edge measures discipline. The case pool is built accordingly: beside the textbook cases it contains the mirror case from chapter 10.7 — a range that looks like a UTAD and resolves upward, the bull trap for bears —, one case each without a spring and without a UTAD, because not every campaign delivers the textbook event, and a range that is no Wyckoff range at all. For that one the correct series is four times "not yet decidable": no trade. That is not an evasion, that is the lesson.
Exercise: Play the first two cases back to back. If in the second you tapped the right direction at an early hold point and still see zero points — read the reasoning twice. It is the core of the whole tool.
7 · The interrogation tally — do you read or do you guess
What: Across all completed cases the tally keeps three metrics: the hit rate, the early-verdict rate — what share of your directional verdicts came before the evidence — and the patience index, which shows how often, at the hold points that demanded neutrality, you actually stayed neutral. The score and your best value stay stored on your device. No countdown, no leaderboard.
Why: The hit rate alone flatters, because it also rewards luck. Only the early-verdict rate separates reading from guessing — and it is the only one of the three numbers you can steer directly: not through more knowledge, but through committing later. Repetition lowers it measurably. That is the whole claim of this metric, and it is enough.
Exercise: Two complete rounds through all six cases, on two different days. Compare not the points but the early-verdict rate of the two rounds. It is the number that describes your future action at the right edge.
Limits & honesty
This tool has clear limits, and they stand here, not in the fine print.
All price paths are models. The ranges, the two endings and the six interrogation cases are teaching constructions, built on the thresholds of the book so that the evidence fits the label. Real markets are messier: there are ranges that do not decide for weeks, volume flanks that alternate several times, and tests that obey no category cleanly. The model teaches the rule — the market tests the exception.
The thresholds are orienting, not universal. Delta limits of 400 contracts, volume factors of 1.8× and 0.7×, the 1.2× rule for the range width: these numbers come from the threshold box in chapter 10.5 and are calibrated for the ES on the 15-minute level. Other markets and time frames scale similarly but not identically — whoever uses them validates them on their own data, by the procedure from chapter 17.
The interrogation checks one stage, not four. Everything here plays on stage 1 of the WVPO funnel, the Wyckoff context. Stages 2 through 4 — volume-profile zones, structure signal, orderflow trigger — are named in the tool but not tested. A passed interrogation delivers a bias, not a trade.
And sometimes the edge stays undecidable — permanently. The Bitcoin case from the opening is in the book for exactly this reason: not as proof that Wyckoff explains everything, but as evidence that even hindsight does not always agree. A protocol that outputs "no trade" in such a case has not failed. It has worked.
And the obvious: This tool produces no signals and no forecasts. It trains a diagnostic discipline. What you do with it belongs in your process, your risk management and your understanding of the risk notice.
Case vocabulary
The three anchor terms of this post, verbatim from the WVPO glossary (translated from the canonical German):
Reaccumulation — "An intermediate pause in the markup, in which the Composite Man tops up his position before he lifts the price further. Looks indistinguishable from distribution at the price level — volume character decides, not price structure." (Book I, ch. 10)
UTAD (Upthrust After Distribution) — "The bear-side mirror of the spring: an overshoot of a resistance with rejection in phase C of the distribution. Anchor of setup 6a." (Book II, ch. 25)
LPS (Last Point of Support) — "A higher low in the markup advance (phase D). Anchor of setup 2." (Book II, ch. 21)
Whoever wants to read up on both sides of this interrogation in real market histories: the post "Gold 2020–2024 — anatomy of an accumulation" shows the one half, "Nasdaq 2021 — anatomy of a distribution" the other. The chart-edge interrogation is the practice hall in between — the place where the two are still indistinguishable.
The case file as audio
Interrogating the Market's Right Edge
Two AI hosts dissect the tool along its book sources.
The printable tool cheat sheet
The six key rules of this tool as a printable page for your trading desk — double opt-in, unsubscribe anytime.