Two charts, side by side. Both show the same session: a trading range over several hours, a sharp slide below support, a recovery back into the middle. Not similar — identical. Every candle of one chart exists exactly the same in the other: same high, same low, same close.
One of the two is the real gold session from June 1 to 2, 2026 — an accumulation that ran over the point of control the same evening and left the sellers of the slide behind. The other carries the same candles and a different story: whoever bought the recovery there was collected in the hours that followed.
If both crime scenes share every candle, then the answer is not in the candles. That is how simple the finding is, and how uncomfortable: the chart image on which most traders build their entire verdict can carry two opposite truths at the same time. A chart without a profile is a crime scene without fingerprints — you see the deed, but not the culprit.
This tool is the signature piece of the method. It lays out the four letters of WVPO for what they are: four layers of evidence over the same scene. And it lets you do more than look at the most important of them — the volume profile — it lets you build it.
Why this instrument
Forensic science solved this problem more than a hundred years ago. A crime scene tells the naked eye only what happened: an open door, missing jewelry, an overturned lamp. Who it was is not in the room — it lies on the surfaces, invisible, until someone dusts for prints. Only the fingerprint links the deed to a culprit.
The price is the crime scene. It shows what happened: fell, rose, broke, recovered. Who it was — exhausted sellers or patient buyers, old inventory overhanging the market or absorption beneath it — that is not in the price. It lies in the volume, and not in the volume below the chart, but in the volume at the price: how many contracts changed hands at which level? The volume profile is the fingerprint powder of market forensics.
Book I, chapter 5 builds the WVPO funnel on this — the method's hierarchy of evidence and the namesake of this tool; chapter 16 closes it with the formula that also carries this tool — four layers, four questions, none replacing another:
- W — Wyckoff: Where in the cycle are we? Accumulation, markup, distribution, markdown — the context that gives every signal its meaning in the first place.
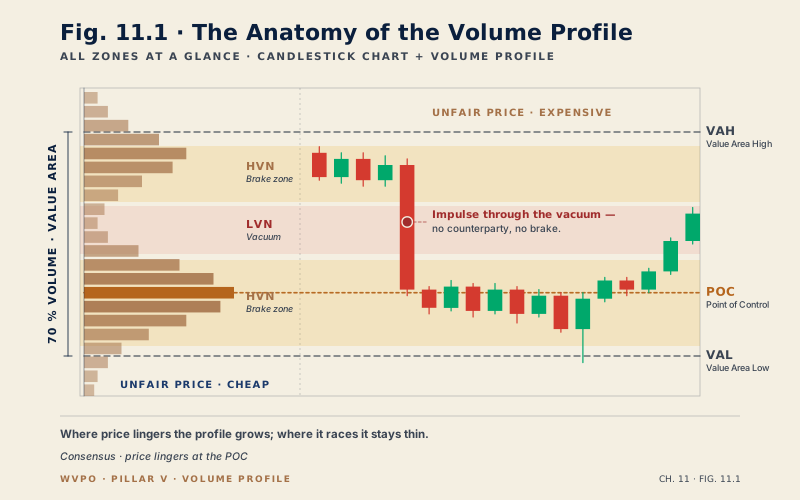
- V — Volume Profile: Where does the market accept price, where does it reject it? POC, value area, HVN and LVN — the map of the auction.
- P — Price Action: What structure holds? Highs, lows, BOS and CHoCH — the grammar in which the market phrases its intent.
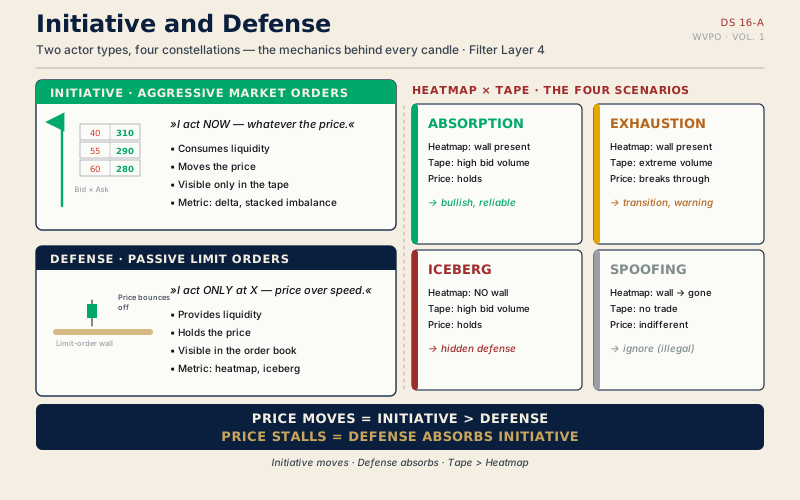
- O — Orderflow: Who was the aggressor, and with how much force? Volume, delta, CVD — the real-time proof that confirms or buries the thesis.
The core thesis of this post follows from that: a verdict on the market is never an observation but a stack. Each single layer can deceive. The price can carry two truths, a volume spike can be panic or absorption, a structural break can hold or fail. The verdict becomes reliable only where the layers agree — and it becomes professional where you say "no call" on thin evidence instead of guessing.
The data basis is split in two and labeled: the main crime scene is real — GC future, 15-minute bars, the composite session of June 1–2, 2026, documented as a verified case in the knowledge base. The twin with the redistributed volume, the delta/CVD teaching layer and the six drill cases are model constructions, marked ◐ MODEL in the tool. None of it is a signal. It is an X-ray machine.
The tool
Begin in the twin crime scene: judge first by the candle chart alone — then dust for prints.
Two crime scenes, every candle identical. One is the real gold session of June 1–2, 2026; the other is a ◐ model with the exact same silhouette and redistributed volume. Only one is an accumulation. Judge — from price alone.
The guided tour — seven handles, seven findings
The order is the tool's demo arc: from the shock of ambiguity to the number that measures the value of the profile against your own judgment.
1 · Twin crime scene — the price alone carries both truths
What: Two charts, every candle identical, no volume visible. You give a verdict: crime scene 1, crime scene 2 — or "no call possible." Only afterward do the volume, the profiles and the resolution of both paths appear.
Why: This is the core thesis as an experience rather than a sentence. The real case and its model twin share the complete silhouette; the answer simply does not exist in the pure price image. Whoever guesses here is tossing a coin — and whoever chooses "no call" judges professionally. After the resolution the fingerprints are on the table: the real crime scene carries the fight at the low — the sweep below the value area ran with 2.51 times the session average, and the profile's center of gravity sits in the middle of the range. The twin carries the trap — the same jab came with 0.45 times the volume, no one fought for the level, and 59% of its volume is lodged in the upper third: old inventory waiting above the market for redemption.
Exercise: Give your verdict before you read on — seriously. Note also how confident you felt. That feeling, with no evidentiary basis, is exactly the feeling with which most losing trades begin.
2 · Construction — tip the chart, build the profile
What: In the lab you tip the real session onto the price grid candle by candle: "tip candle" for the single step, auto-tip for the run. Each volume falls into the price rows its candle touches, and on the right the profile grows — row by row, 50 candles long.
Why: The volume profile is not an indicator a vendor lays over the chart. It is the same chart, rotated 90 degrees: instead of "how much was traded per quarter hour?" it answers "how much was traded per price level?" Book I, chapter 11 calls that the switch from the time axis to the price axis of the auction. Whoever has stacked the profile themselves once never reads it as decoration again — they know that every row holds candles, and that a high node is nothing other than many quarter hours that agreed to meet at the same level.
Exercise: Tip the first ten candles one at a time and, before each candle, say out loud which rows are about to grow. From what point can you sense the POC region? Most see it long before the last candle — the profile converges, because acceptance repeats.
3 · Cross-examination — every profile row has a case number
What: Tap a profile row: the candles that supplied this volume light up in the chart, all others step back. Tap a candle in reverse: its rows mark themselves in the profile. For the keyboard there are two sliders; the log beneath names the share, candle count and timestamp.
Why: A profile is an archive, not a painting. The POC row of this session — 4,512 to 4,514 — gathers 9.9% of the total volume from 26 candles, the first at 12:45, the last at 22:45 New York time. That means: this price level was accepted again and again all afternoon and evening, before and after the spring. That is exactly what distinguishes a load-bearing node from a chance heap. And the spring candle at 21:45 shows its span under cross-examination: 2,128 contracts, spread from 4,492 to 4,514 — a single quarter hour that traverses half the map.
Exercise: Find the thickest row of the profile and read its timestamps. Then find a thin row below the value area and compare: few candles, a brief appearance. You have just interrogated HVN and LVN, not learned them.
4 · Layers of evidence — four questions to the same scene
What: Four switches lay the funnel stages of the method over the scene one at a time: the Wyckoff phase band, the volume profile with its landmarks, the price action mark of the CHoCH at 4,505.7 — and the orderflow layer with a real volume bar and a delta/CVD trace labeled as a ◐ teaching layer.
Why: Each layer answers exactly one question, and none answers the other's. The phase band places the moment in the cycle; the profile locates the sweep — it ends below the value area, in the territory of the stops; the CHoCH mark names the level whose reclaim turns the structure; the orderflow trace shows the moment of absorption: at the spring the CVD falls to its session low — maximum selling effort — and two bars later the price closes back in the value area, while the CVD has reclaimed only 14% of its distance. Effort without result: that is the fingerprint of the buyers who held still. Book I, chapter 16 works out this piece of evidence at the footprint level.
Exercise: Switch off all layers, set the construction to the spring candle and then switch on one layer after another — in any order. Before each switch, formulate the question that this layer answers. If you can ask the four questions by heart, you have understood the model; the tool only checks whether you apply it.
5 · Your own landmarks — value is calculable, not negotiable
What: As soon as all volume is distributed, you set POC, VAH and VAL yourself: drag lines or use plus/minus keys. Then you measure yourself against the canonical values of the verified case — VAL 4,496.0 · POC 4,512.9 · VAH 4,520.8 — and get the deviation in points.
Why: The value area is not an opinion but a computational rule: the POC as the highest-volume level, then 70% of the volume gathered around it. Whoever sets the landmarks by hand trains the eye for exactly this distribution — and learns its limits at the same time: our own recalculation from the 15-minute candles hits the POC to within about two points, while the VAL deviates by several points depending on the distribution method. The documented case levels remain binding; the lesson is to think in zones, not lines.
Exercise: Set the three marks before you resolve, and note your deviations. Repeat it tomorrow on the same case. Under five points per mark is a good eye — consistently under three is operator level.
6 · Blind report — a verdict under growing evidence
What: Six sealed cases, each in four evidence stages: first the price alone, then volume, then the profile, then orderflow. At each stage you give a verdict — accumulation, distribution or "no call" — and may revise it with each new layer. Only after the fourth stage does the resolution run.
Why: The six cases are three silhouette pairs: each candle chart exists twice in the pool, once as accumulation, once as distribution — only volume, profile and delta distinguish them. At stage one the correct answer is therefore literally unknowable; "no call" there is not evasion but the only sentence an expert could sign. From stage two the evidence begins to hold: a sweep with 0.40 times the average volume tried to collect no one; a POC in the upper half tells of distribution, not of absorption; a recovery whose delta stays negative rises without buyers — it falls the moment the pushing stops.
Exercise: Contest all six cases in one session and force yourself to an honest answer at stage one. If you guess there more often than you abstain, you have not yet digested the twin crime scene — go back to handle 1.
7 · Evidentiary tally — the value of the profile, in percentage points
What: The tally beneath the report keeps the books, separated by evidence stage: hits, misjudgments, abstentions — for "price only" through "full stack." It stays stored on your device and grows across sessions. No countdown, no leaderboard.
Why: "The profile is important" is a claim. "With the full stack I hit 34 percentage points more often than with naked price" is a measurement — and your own, on your own judgments. The tally makes the value of each layer empirical, in the smallest possible laboratory. It is at the same time an inoculation against the hindsight feeling that you "saw it on the chart": your stage-1 rate stands beside it and tells the truth.
Exercise: Collect at least two complete rounds through all six cases before you read the difference. Small samples are noisy — that holds for this tally just as for any trading statistic someone wants to sell you.
Limits & honesty
This tool has clear limits, and they stand here, not in the fine print.
The twin is a construction. Its candles are real, its volume is not: it was redistributed so that the same silhouette tells the counter-story — a thin sweep, old inventory on top, a recovery without participation. Real traps are rarely so textbook. The twin proves the ambiguity of the price; it does not prove that every range can be a trap.
The orderflow layer is a teaching schema. The delta and CVD of this session do not come from tick data but from a model that reproduces the documented absorption mechanic of the case — that is why the trace carries the ◐. The volume bar beside it is real. Whoever works with real footprint data sees the same patterns messier.
Profile landmarks are method-dependent. Bin size, the distribution assumption per candle and the 70% convention shift the POC and value area by points; our recalculation documents that openly. Whoever uses other settings gets other edges — one more reason to trade zones instead of lines.
Two cases are not a sample, and neither are six drills. The real case is verified, but it is a single case; the drill cases are generated so that the evidence matches the label. The tally measures your diagnostic skill on this teaching material — not your future hit rate in the market.
And the obvious: the X-ray produces no signals and no forecasts. It trains a way of seeing. What you do with it belongs in your process, your risk management and your understanding of the risk notice.
Case vocabulary
The three anchor terms of this post, verbatim from the WVPO glossary (translated from the canonical German):
WVPO funnel (W/V/P/O) — "The four-stage hierarchy of evidence in the analysis: Wyckoff bias (context) → volume zones (location) → price action/structure (signal) → orderflow (trigger). Four layers, four questions — the order is not negotiable." (Book I, ch. 5 + 16)
VAH / VAL / POC — "Value area high / low and point of control — the liquidity landmarks of the volume profile (layer 2)." (Book I, ch. 11)
HVN / LVN — "High-/low-volume node: zones of accepted (HVN) or rejected (LVN) prices." (Book I, ch. 11)
For anyone who wants to read the landmarks calmly before building them: the post "The Volume Profile: POC, Value Area & LVN" explains the map — the X-ray is the surveying exercise for it. And for anyone who wants to know whether the rules trade this spring: tool no. 1, the spring test bench, checks the same crime scene against setups 1a and 1b. The answer: a genuine spring that the rules do not trade.
The printable tool cheat sheet
The six key rules of this tool as a printable page for your trading desk — double opt-in, unsubscribe anytime.